Finding relevant log entries with a correlation ID (FREE SELF)
GitLab instances log a unique request tracking ID (known as the "correlation ID") for most requests. Each individual request to GitLab gets its own correlation ID, which then gets logged in each GitLab component's logs for that request. This makes it easier to trace behavior in a distributed system. Without this ID it can be difficult or impossible to match correlating log entries.
Identify the correlation ID for a request
The correlation ID is logged in structured logs under the key correlation_id
and in all response headers GitLab sends under the header x-request-id.
You can find your correlation ID by searching in either place.
Getting the correlation ID in your browser
You can use your browser's developer tools to monitor and inspect network activity with the site that you're visiting. See the links below for network monitoring documentation for some popular browsers.
- Network Monitor - Firefox Developer Tools
- Inspect Network Activity In Chrome DevTools
- Safari Web Development Tools
- Microsoft Edge Network panel
To locate a relevant request and view its correlation ID:
- Enable persistent logging in your network monitor. Some actions in GitLab redirect you quickly after you submit a form, so this helps capture all relevant activity.
- To help isolate the requests you are looking for, you can filter for
documentrequests. - Select the request of interest to view further detail.
- Go to the Headers section and look for Response Headers. There you should find an
x-request-idheader with a value that was randomly generated by GitLab for the request.
See the following example:
Getting the correlation ID from your logs
Another approach to finding the correct correlation ID is to search or watch
your logs and find the correlation_id value for the log entry that you're
watching for.
For example, let's say that you want learn what's happening or breaking when you reproduce an action in GitLab. You could tail the GitLab logs, filtering to requests by your user, and then watch the requests until you see what you're interested in.
Getting the correlation ID from curl
If you're using curl then you can use the verbose option to show request and response headers, as well as other debug information.
➜  ~ curl --verbose "https://gitlab.example.com/api/v4/projects"
# look for a line that looks like this
< x-request-id: 4rAMkV3gof4
Using jq
This example uses jq to filter results and display values we most likely care about.
sudo gitlab-ctl tail gitlab-rails/production_json.log | jq 'select(.username == "bob") | "User: \(.username), \(.method) \(.path), \(.controller)#\(.action), ID: \(.correlation_id)"'"User: bob, GET /root/linux, ProjectsController#show, ID: U7k7fh6NpW3"
"User: bob, GET /root/linux/commits/master/signatures, Projects::CommitsController#signatures, ID: XPIHpctzEg1"
"User: bob, GET /root/linux/blob/master/README, Projects::BlobController#show, ID: LOt9hgi1TV4"Using grep
This example uses only grep and tr, which are more likely to be installed than jq.
sudo gitlab-ctl tail gitlab-rails/production_json.log | grep '"username":"bob"' | tr ',' '\n' | egrep 'method|path|correlation_id'{"method":"GET"
"path":"/root/linux"
"username":"bob"
"correlation_id":"U7k7fh6NpW3"}
{"method":"GET"
"path":"/root/linux/commits/master/signatures"
"username":"bob"
"correlation_id":"XPIHpctzEg1"}
{"method":"GET"
"path":"/root/linux/blob/master/README"
"username":"bob"
"correlation_id":"LOt9hgi1TV4"}Searching your logs for the correlation ID
Once you have the correlation ID you can start searching for relevant log
entries. You can filter the lines by the correlation ID itself.
Combining a find and grep should be sufficient to find the entries you are looking for.
# find <gitlab log directory> -type f -mtime -0 exec grep '<correlation ID>' '{}' '+'
find /var/log/gitlab -type f -mtime 0 -exec grep 'LOt9hgi1TV4' '{}' '+'
/var/log/gitlab/gitlab-workhorse/current:{"correlation_id":"LOt9hgi1TV4","duration_ms":2478,"host":"gitlab.domain.tld","level":"info","method":"GET","msg":"access","proto":"HTTP/1.1","referrer":"https://gitlab.domain.tld/root/linux","remote_addr":"68.0.116.160:0","remote_ip":"[filtered]","status":200,"system":"http","time":"2019-09-17T22:17:19Z","uri":"/root/linux/blob/master/README?format=json\u0026viewer=rich","user_agent":"Mozilla/5.0 (Mac) Gecko Firefox/69.0","written_bytes":1743}
/var/log/gitlab/gitaly/current:{"correlation_id":"LOt9hgi1TV4","grpc.code":"OK","grpc.meta.auth_version":"v2","grpc.meta.client_name":"gitlab-web","grpc.method":"FindCommits","grpc.request.deadline":"2019-09-17T22:17:47Z","grpc.request.fullMethod":"/gitaly.CommitService/FindCommits","grpc.request.glProjectPath":"root/linux","grpc.request.glRepository":"project-1","grpc.request.repoPath":"@hashed/6b/86/6b86b273ff34fce19d6b804eff5a3f5747ada4eaa22f1d49c01e52ddb7875b4b.git","grpc.request.repoStorage":"default","grpc.request.topLevelGroup":"@hashed","grpc.service":"gitaly.CommitService","grpc.start_time":"2019-09-17T22:17:17Z","grpc.time_ms":2319.161,"level":"info","msg":"finished streaming call with code OK","peer.address":"@","span.kind":"server","system":"grpc","time":"2019-09-17T22:17:19Z"}
/var/log/gitlab/gitlab-rails/production_json.log:{"method":"GET","path":"/root/linux/blob/master/README","format":"json","controller":"Projects::BlobController","action":"show","status":200,"duration":2448.77,"view":0.49,"db":21.63,"time":"2019-09-17T22:17:19.800Z","params":[{"key":"viewer","value":"rich"},{"key":"namespace_id","value":"root"},{"key":"project_id","value":"linux"},{"key":"id","value":"master/README"}],"remote_ip":"[filtered]","user_id":2,"username":"bob","ua":"Mozilla/5.0 (Mac) Gecko Firefox/69.0","queue_duration":3.38,"gitaly_calls":1,"gitaly_duration":0.77,"rugged_calls":4,"rugged_duration_ms":28.74,"correlation_id":"LOt9hgi1TV4"}Searching in distributed architectures
If you have done some horizontal scaling in your GitLab infrastructure, then you must search across all of your GitLab nodes. You can do this with some sort of log aggregation software like Loki, ELK, Splunk, or others.
You can use a tool like Ansible or PSSH (parallel SSH) that can execute identical commands across your servers in parallel, or craft your own solution.
Viewing the request in the Performance Bar
You can use the performance bar to view interesting data including calls made to SQL and Gitaly.
To view the data, the correlation ID of the request must match the same session as the user viewing the performance bar. For API requests, this means that you must perform the request using the session cookie of the signed-in user.
For example, if you want to view the database queries executed for the following API endpoint:
https://gitlab.com/api/v4/groups/2564205/projects?with_security_reports=true&page=1&per_page=1First, enable the Developer Tools panel. See Getting the correlation ID in your browser for details on how to do this.
After developer tools have been enabled, obtain a session cookie as follows:
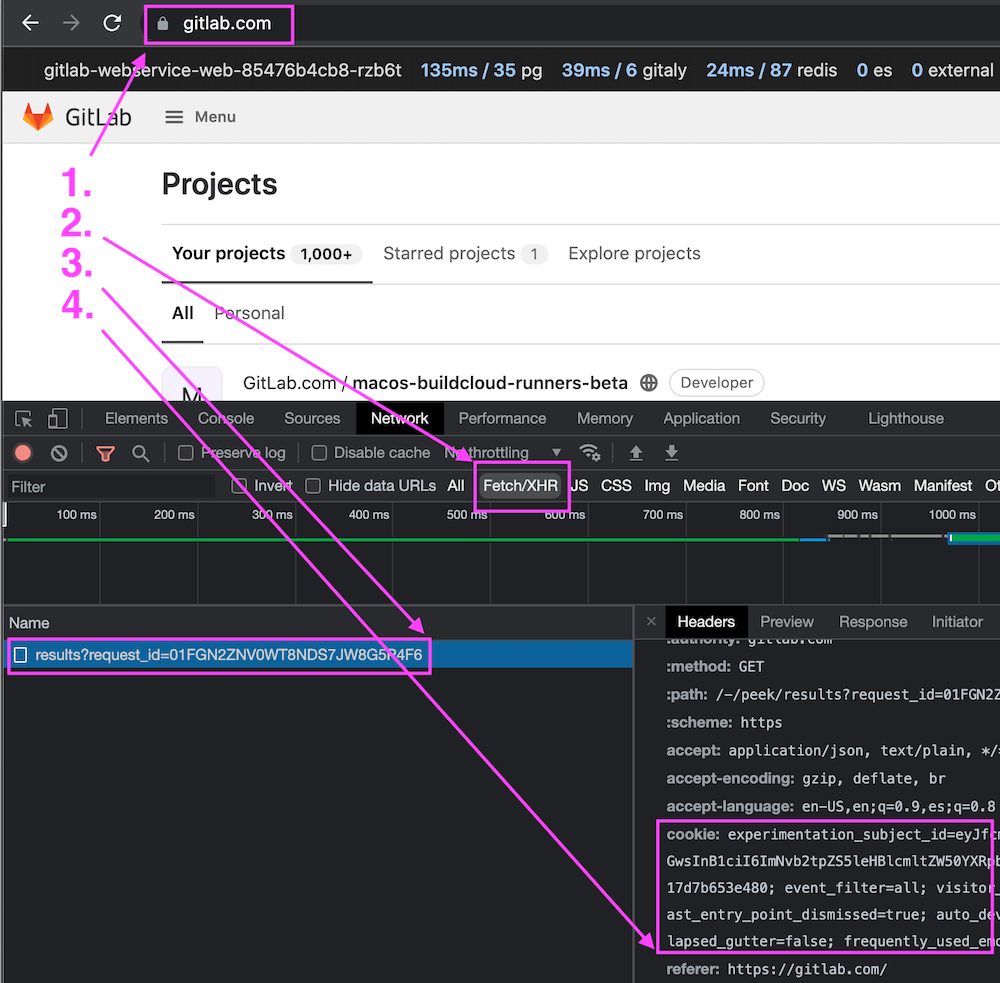
- Visit https://gitlab.com while logged in.
- Optional. Select Fetch/XHR request filter in the Developer Tools panel. This step is described for Google Chrome developer tools and is not strictly necessary, it just makes it easier to find the correct request.
- Select the
results?request_id=<some-request-id>request on the left hand side. - The session cookie is displayed under the
Request Headerssection of theHeaderspanel. Right-click on the cookie value and selectCopy value.
You have the value of the session cookie copied to your clipboard, for example:
experimentation_subject_id=<subject-id>; _gitlab_session=<session-id>; event_filter=all; visitor_id=<visitor-id>; perf_bar_enabled=true; sidebar_collapsed=true; diff_view=inline; sast_entry_point_dismissed=true; auto_devops_settings_dismissed=true; cf_clearance=<cf-clearance>; collapsed_gutter=false; frequently_used_emojis=clap,thumbsup,rofl,tada,eyes,bowUse the value of the session cookie to craft an API request by pasting it into a custom header of a curl request:
$ curl --include "https://gitlab.com/api/v4/groups/2564205/projects?with_security_reports=true&page=1&per_page=1" \
--header 'cookie: experimentation_subject_id=<subject-id>; _gitlab_session=<session-id>; event_filter=all; visitor_id=<visitor-id>; perf_bar_enabled=true; sidebar_collapsed=true; diff_view=inline; sast_entry_point_dismissed=true; auto_devops_settings_dismissed=true; cf_clearance=<cf-clearance>; collapsed_gutter=false; frequently_used_emojis=clap,thumbsup,rofl,tada,eyes,bow'

  date: Tue, 28 Sep 2021 03:55:33 GMT
  content-type: application/json
  ...
  x-request-id: 01FGN8P881GF2E5J91JYA338Y3
  ...
  [
    {
      "id":27497069,
      "description":"Analyzer for images used on live K8S containers based on Starboard"
    },
    "container_registry_image_prefix":"registry.gitlab.com/gitlab-org/security-products/analyzers/cluster-image-scanning",
    "..."
  ]
The response contains the data from the API endpoint, and a correlation_id value, returned in the x-request-id header, as described in the Identify the correlation ID for a request section.
You can then view the database details for this request:
-
Paste the
x-request-idvalue into therequest detailsfield of the performance bar and press Enter/Return. This example uses thex-request-idvalue01FGN8P881GF2E5J91JYA338Y3, returned by the above response: -
A new request is inserted into the
Request Selectordropdown on the right-hand side of the Performance Bar. Select the new request to view the metrics of the API request: -
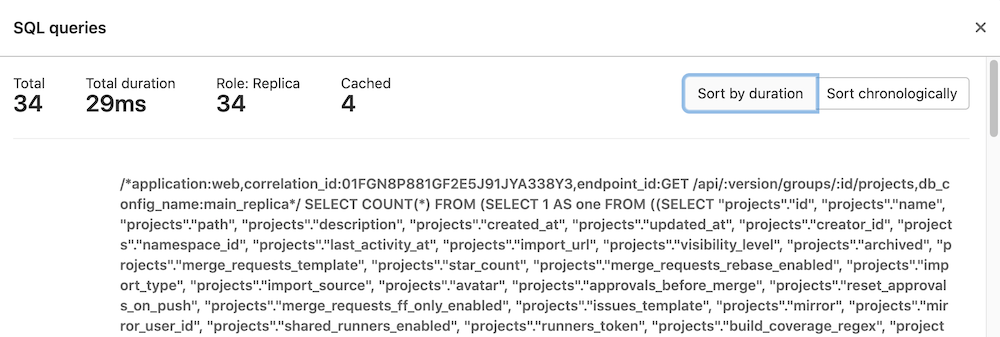
Select the
pglink in the Progress Bar to view the database queries executed by the API request:The database query dialog is displayed:


